
Inbox
#VisualizeChange: A World Humanitarian Summit Data Challenge
Win a trip to Geneva, Switzerland to showcase your work at the Global Consultation Conference
Leading up to the first-ever World Humanitarian Summit convened by the United Nations Secretary-General Ban Ki-moon, thousands of people worldwide have shared their ideas to reduce human loss and suffering from crisis. Can you help visualize these ideas? The winner will get the opportunity to present their work at the Global Consultation in Geneva, Switzerland in October 2015 and the best visualizations will be showcased at related events worldwide.
Download the visualization dataset here: WHS MASTER DATA CATALOGUE
We challenge you to:
Use the consultation data provided in order to develop an original and thought provoking illustration of information collected through the consultation process. The consultation data is by no means final or exhaustive but a comprehensive snapshot of an ongoing and dynamic consultation process to date.
Both infographics and interactive visualizations (preferred) may be submitted.
What is the task?
Visualize information based on topics, trends and issues emerging from the data collected through the consultation process. Information should be represented to allow for the disaggregation of data (type, input/output to the process, issues, geographical representation, contributor information).
Participants are encouraged to examine the following questions:
What topics were identified and how do they relate to each other? Qualitative data characteristics can be inferred from the WHS data collection and the developed taxonomy
What are the differences in how the topics arose across various data types (public submissions, final consultation reports, stakeholder analysis pieces, online consultation data characteristics and/or others)?
Are there other key elements or topics that can be defined emerging from the data collection within the predefined topics or outside of it?
Bonus: Visualization allows data points to refer back to original content from data collection
Data
World Humanitarian Summit Master Data Catalogue:
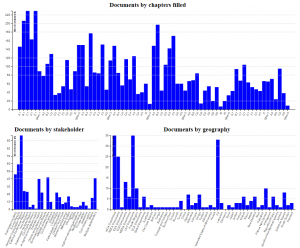
The World Humanitarian Summit Consultation data can be downloaded here: WHS MASTER DATA CATALOGUE or in the resource section on your right. The dataset includes information from nearly 500 documents (but not the documents themselves) that the consultation process has generated as per July 2015. The qualitative data is categorized in emerging themes and sub-themes that have been identified according to a developed taxonomy (blue columns). Please refer to the taxonomy documentation for further reference.
The data is further structured into specific data category tags (green columns) that specify the nature of the document (what type of document is it, where does it come from, what is the geographical context, what particular stakeholder groups are involved, is it an input or an output to the consultation process). In case a particular category applies, the document information is flagged with an “x” in the corresponding column. Please refer to the category documentation for further reference.
Please note that the data catalogue does NOT include the original raw data files for data security reasons. All substantive data has been preprocessed (extracted from these raw files, categorized and aggregated) already for your visualization pleasure.
Who can participate?
● Any individual can participate – there are no geographical or age restrictions.
● Any institution or organization wishing to put together an entry should do so in the
name of one person. Additional contributors may be added to the description of the
visualization.
Please note that finalists will be subjected to normal travel regulations to Switzerland, and may be required to procure a travel visa.
Can I enter more than once?
Yes, as long as you enter before the deadline (EXTENDED) of 13 September 2015, 11:59 PM EST. Only your last submission will be judged.
Both static and interactive visualizations may be submitted. Entries will be judged on a combination of the following criteria:
● Originality
● Artistry
● Understanding of the data
● Clarity of information
● Usefulness to the viewer
When will the winners be announced?
Finalists will be announced in advance of the World Humanitarian Summit Global Consultation Conference, taking place in Geneva/Switzerland from October 14-16. The winner will be invited and sponsored to exhibit the work in Geneva in the margins of the WHS Global Consultation Conference.
For any questions regarding the challenge, please contact the #VisualizeChange team at visualizechange@whsummit.org
(Note: For a Spanish version please download the pdf file in the resource section on your right / Para leer el reto en español descarga el pdf en la parte de “resources” en la columna de la derecha.)
View winning solutions
|
|
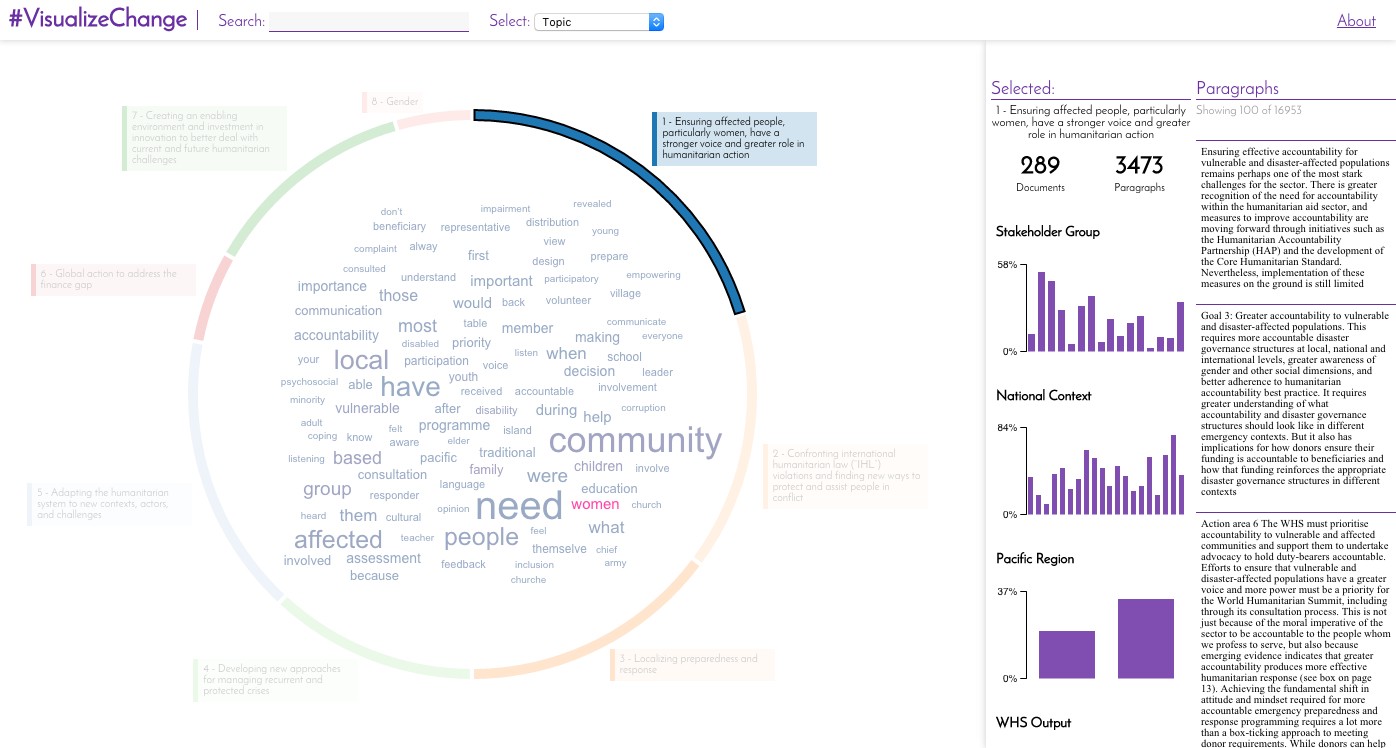
WHS Explorer1st place Mr. Christian Felix WHS Explore is a tool built to allow exploration of the WHS dataset. It uses a ring visualization associated with a wordcloud that can show relevant words for different variables including Topics and National Context. |
|
|
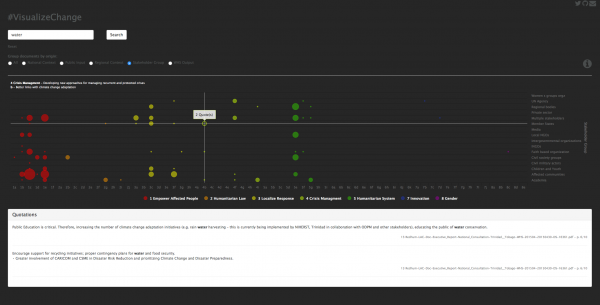
#ExploreChangeFinalist Mr. Stephan Schlögl This application provides interactive access to the collected data.It facilitates the access to thousands of quotations from the collected documents based on the categorization of documents, themes and subthemes. |
|
|
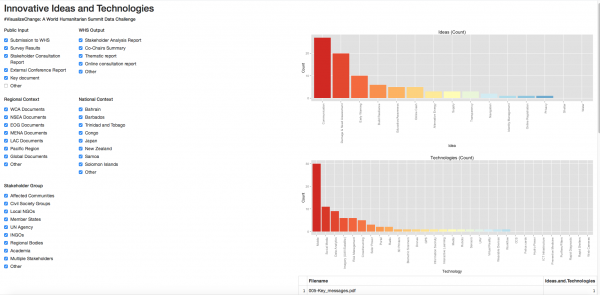
Innovative Ideas & TechnologiesFinalist Mr. Ofir Shalev The goal of this analysis is to identify the most prominent needs, ideas and technologies and to provide actionable insights to allow decision makers to prioritize the investment according to the most important needs. The web tool allows to slice and dice the data based on 38 parameters categorized into 5 major categories (Public Input, WHS Output, Stakeholder Group, Regional Context and National Context). |
|
|
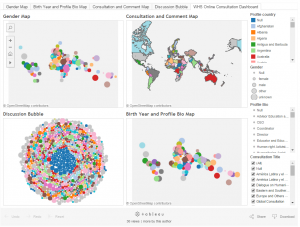
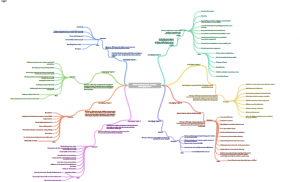
WHS Online Consultation Dashboard & Coggle Mindmap of WHS Emerging ThemesFinalist Mr. Francis Josef Cruz Gasgonia WHS Online Consultation Dashboard - This visualization shows the WHS Online Consultation with a geographic reference for gender, bio profile, and comment participation during the online consultation. Coggle Mind Map of WHS Emerging Items/Themes - I used Coggle to visualize the tabled World Humanitarian Summit Emerging Items/Themes. It's a free online public tool that allows users to visualize ideas in collobartive and creative ways through Mind Maps. |
|
|
When Spider Webs Unite They Can Tie Up a LionFinalist Mrs. Maraya Pearson This data visualization is an exploration of our world. We survey the landscape of both the global bad news (the lion) and the global good news (the spider webs). Then we end our journey exploring the power to unite (human empathy). Through this last section, we find out what people are thinking worldwide and listen to what humanitarians are saying through the World Humanitarian Summit. |

|
|
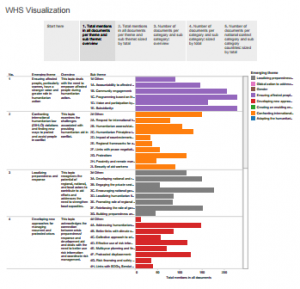
WHS VisualizationFinalist Mr. Puneet Mohan Sangal The storyboard consists of 5 dashboards. The first and second identify the emerging themes, sub themes, and how they relate to each other. The third and fourth identify the categories of submissions. |
|
|
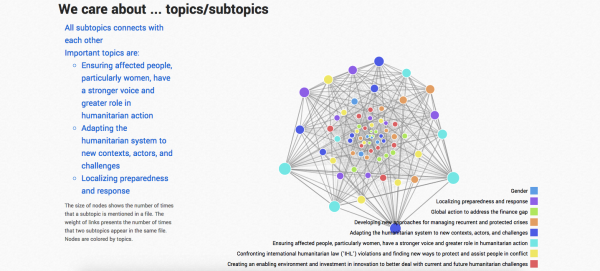
Investigation of Humanitarian TopicsFinalist Ms. Yilin Wei The goal of this data visualization is to investigate topics about humanity. It explores the connections between topics and subtopics, stakeholder analysis and gives context to the conversation. The data comes from WHS master catalogue and Twitter. |
|
|
WHS Documents NavigatorFinalist Mr. Thomas Fournaise This interactive data visualization is a new way to navigate in documents. When you click on a bar, the graph is recalculated to show how many documents contain the specific themes you are looking for. |
|
|
WHS Consultations BrowserFinalist Mr. Dominik Cygalski Thousands of people worldwide have shared their ideas to reduce human loss and suffering from crisis. Leading up to the first-ever World Humanitarian Summit convened by the United Nations, many documents were created which contain those ideas. |
Challenger organizations:
![]()
World Humanitarian Summit
The World Humanitarian Summit is an initiative of United Nations Secretary-General Ban Ki-moon, managed by the United Nations Office for the Coordination of Humanitarian Affairs (UN OCHA). The summit brings together governments, humanitarian organizations, people affected by humanitarian crises, the private sector and other partners to propose solutions to our most pressing challenges. The goal is to bring the global community together to commit to new ways of collaborating and working together to save lives and reduce hardship around the globe.
Help to Improve This Idea.