Inbox
Background:
Sustainable development as an approach tries to understand the world in an integrated, systemic way and focuses on the links among areas. The recently adopted United Nations Sustainable Development Goals (SDGs) have defined 17 goal areas, from poverty to oceans to inequality, ecosystems, economic growth, education, etc. Multiple relationships exist among all these goals. A challenge going forward is to better understand them, and map them in a way that is easy to understand while preserving the complexity of the whole. Institutions working on specific areas of sustainable development (e.g. education, energy, slums, etc.) tend to explore and focus on limited aspects of the map. Their policy messages emphasize the importance of specific links. However, for policy discussions, the whole map is needed.
We Challenge You to:
Use your skills to build an automated tool that extracts from a set of UN publications all the messages that relate to the relationships between urban development (SDG 11), and all the other SDG areas, and then visualize the results.
The winner solution will be announced on 15 February 2016. The best solution or solutions will be showcased on the UNDSD website and on the Unite Ideas website, and may be referenced in the 2016 Global Sustainable Development Report.
What is the task?
Part 1) Through automated text analysis, identify and extract all the messages in the given collection of UN publications that refer to SDG 11 (Sustainable cities & communities) in relation to another SDG area.
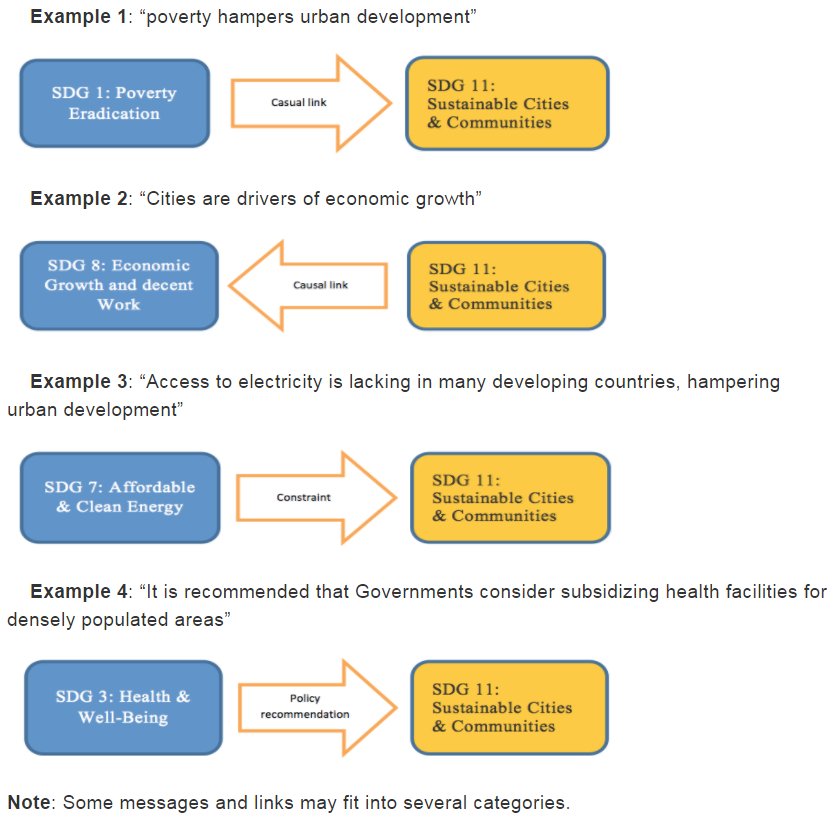
Part 2) Classify each message corresponding to the (directional) link between the relevant SDGs (e.g. from SDFG 11 to SDG X or from SDG X to SDG 11).
Part 3) Classify each message into one or more of these categories:
● Causal link (A causes B)
● Constraint, barriers, or challenges
● Policy recommendations See examples below of texts which should be extracted and the direction and classification of links:
At this stage, all the links should be retained.
Part 4) Synthesize this data, focusing on the following questions:
● What are the causal links between urban development and other SDGs identified by the reports?
● What are challenges and obstacles highlighted by these reports in relation to the various linkages?
● Which policy areas receive the most emphasis in the set of reports analysed, in relation to the various linkages?
● What linkages do different reports focus on?
Synthesis and visualization of the data can encompass text extracts, figures and maps showing the links among SDG areas, policies that focus on specific links, and other products allowing for synthesis of a large amount of information. At this stage, additional criteria may be used to differentiate the links (e.g. positive/negative feedback, reinforcement, neutral link, etc.); these can be shown in different colors, or distinguished in other ways depending on the visualization solution.
Ideally, data visualizations should allow data points to refer back to the original text or contextual information. Synthesis and visualization is likely to involve selection among messages. Indicate what criteria are used to select the “most relevant” data.
References or similar projects:
For inspiration view this working paper addressing similar questions in the context of the linkages between education and other SDGs:
http://www.un.org/esa/desa/papers/2015/wp146_2015.pdf
Deliverables:
Your submission to this challenge must include the following materials:
● A web link (url) to a working (live) demo
● Open source original code, data files and other electronic files hosted in a public repository (include GNU license). (It is acceptable and encouraged to leverage existing open source tools).
● A brief PDF document describing your project, which should include:
◦ Abstract: A brief summary of the project.
◦ Approaches: Describe the approaches used for examining and analyzing the data.
◦ Solutions: Describe how your product answers the question posed, and how it synthesizes the information contained in the reports.
◦ Tools Utilized: Describe which technologies you leveraged during your project.
Data:
The project should make use of the reports selected by the challenge team, which can be accessed from Google Drive or Dropbox. You can also refer to the list of documents at the right side of this page.
Who can participate?
● This challenge is open to the general public. We welcome the participation of students, data scientists, data journalists, and graphic designers.
● Teams can submit by acknowledging all contributors under the “description” field on the submissions form.
● Participants can submit as many solutions to this challenge as they would like.
Both static and interactive visualizations may be submitted. All solutions will be reviewed by a committee composed of IT specialists and sustainable development experts of the United Nations. Only original, open source work will be accepted (which can use or build upon existing open source tools). Entries will be judged on a combination of the following criteria:
● Alignment with challenge objectives
● Sound data analysis and accuracy of results
● Originality
● Clarity of information
● Use friendliness
Deadline: 31 January 2016, 11:59 PM EST
For any questions regarding the challenge, please contact the #LinksSDGs team at gsdr2015@gmail.com
View winning solutions
|
|
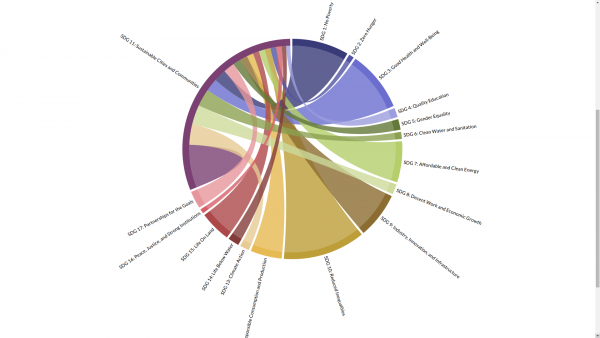
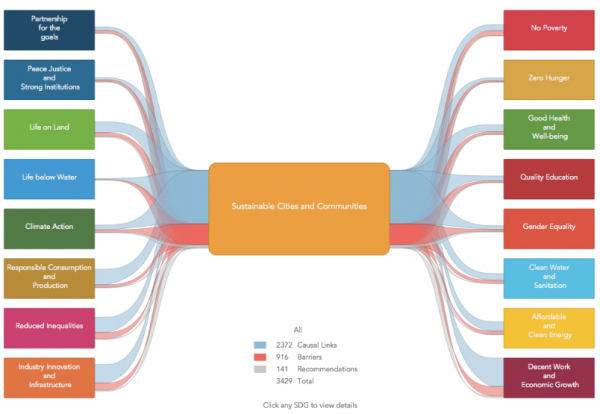
Links to Sustainable Cities1st place Mr. Abdulqadir Rashik Links to Sustainable Cities, an interactive data visualization, presents the viewer with flows that depict how differently classified links are proportionally divided between the various SDGs. The visualization extracts links from documents classified either causal links, barriers, or recommendations. The width of the flow into any SDG is proportional to the number of links between it and SDG 11. For example, one can easily infer that the number of links to SDG 14 "Life below Water" is very small, whereas the most number of links were found to SDG 8 "Decent Work and Economic Growth". The actual number and breakdown of links into its different types is shown at the bottom center when hovering upon any SDG. Clicking on any individual SDG allows a user to drill down into a detailed breakdown that displays the link types and the text of the links. Further filtering the links based on their type is also possible. Links have not been classified based on directionality, so links of the same type are grouped together regardless of link direction. |
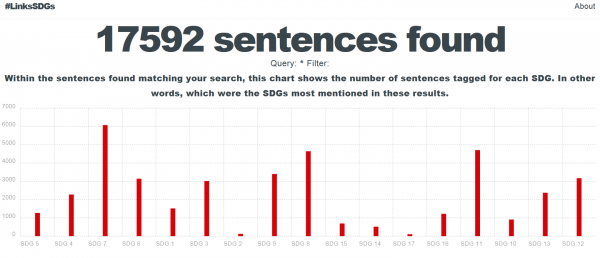 |
#LinksSDGs Tagger2nd place Mr. Jorge Martinez-Navarrete This machine-based literature review analyzed 47 United Nations publications, extracted sentences linking at least two SDGs, and categorized each link as being a policy recommendation, a causal link, or a constraint. |
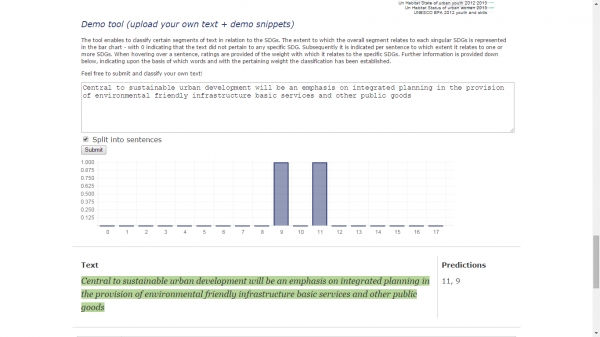 |
A PARC solution3rd place Mr. Wouter Eekhout An automated classifier that has been trained on the basis of the formulation of SDGs and their pertaining targets to identify how certain texts relate to specific aspects. The recently adopted United Nations Sustainable Development Goals (SDGs) set forth an intergovernmental plan for eradicating global poverty in all its forms and dimensions. Multiple relationships exist among the 17 goals. A challenge going forward is to better understand the interrelation between them and how policies towards their realisation could complement each other. Institutions working on specific areas of sustainable development tend to explore and focus and explore limited aspects of the map. Their policy messages emphasize the importance of specific links. The following study provides an overview of the various links between the sustainable development goals throughout key policy documents - with a specific focus on the message that relates to urban development (SDG 11). For this purpose, we have developed an automated classifier to identify how certain texts relate to specific aspects and how these focus areas might be addressed in relation to each other. The classifier has been trained on the basis of the formulation of SDGs and their pertaining targets. The demo can be found here: http://linkssdgs.herokuapp.com/index.jsp#demo_classifier We have provided several visualisations of the classification results with more detailed explanation. Moreover, a demo version of the classification tool is, while further information regarding the used approach and methodology behind it can be retrieved through the following link: http://parc.herokuapp.com/file/2014WouterEekhout.pdf The training set and built upon the formulation of the SDGs and their pertaining targets can be found here |
 |
Team Quasingo4th place Team Quasingo This solution presents a self-designed, automated analytics process that extracts texts from various U.N. flagship publications and three chord diagrams that shows the casual, constaint and neutral links between SDG11. The team has joined efforts in text extraction from UN flagship reports, inference classification, data visualization, and comprehensive synthesis. The linkages between each Goal are then translated into policy recommendations to inform decisionmakers and drive change. Please find the detailed description about the solution at http://www.quasingo.org/teamquasingo/report.pdf Team members are students at Carnegie Mellon University: Sandeep Konam, Michael Rosenberg, Minyoung Rho, Ticha Sethapakdi, Allison Fisher, and Robin Park |
Challenger organizations:

UN DESA Division for Sustainable Development
The Division for Sustainable Development (DSD) provides leadership in promoting and coordinating implementation of the sustainable development agenda of the United Nations. The work of the Division translates into five core functions: (1) Support to UN intergovernmental processes on sustainable development; (2) Analysis and policy development; (3) Capacity development at the country level; (4) Inter-agency coordination; and (5) Knowledge management, communication and outreach.

Help to Improve This Idea.